“Using phase diagrams with microseeding to prepare crystal samples for advanced data collection techniques”
_
Date and Time
2:00 PM – 3:00 PM Tuesday, December 9th, 2025
Location
Hybrid(CryoEM building and Zoom)
Speakers: Patrick D. Shaw Stewart
Douglas Instruments Ltd(UK)
University of Southampton(UK)

Abstract
Serial data collection and microED techniques typically require “slurries” of tiny, well-ordered crystals [1]. Neutron diffraction requires very large single crystals. Creating samples for these techniques is often a complex process that requires multiple rounds of optimization. To guide them in this task, protein crystallizers often keep a notional phase diagram in mind, which has four zones: an undersaturated zone where protein always remains in solution, a metastable zone where crystals will grow when seeds are added, a crystal nucleation zone where crystals appear spontaneously, and a protein precipitation zone. However, the shape of real-life phase diagrams can vary, making the interpretation of experimental results difficult. It is therefore very helpful to determine the phase diagrams of individual target proteins experimentally. Douglas Instruments, in collaboration with the University of Southampton, has introduced a rapid and straightforward method for generating custom phase diagrams using just 15 – 60 µL of protein [Fig. 1]. The most straightforward approach utilizes the microbatch-under-oil method to prevent concentrating the sample drop (as would occur in a vapor diffusion setup). By carrying out the same procedure with and without a seedstock, the metastable zone can be identified [2]. Moreover, advanced methods often require relatively large sample volumes, and microbatch can easily be scaled up to 50 µL or larger “batches” using robotics. A new variation of the method eliminates the need for oil by using a sitting drop setup, where solutions are dispensed to the reservoirs that exactly balance the concentrations of the drops. We present case studies where phase diagrams were utilized to enhance control and crystal quality for both routine and advanced data collection.
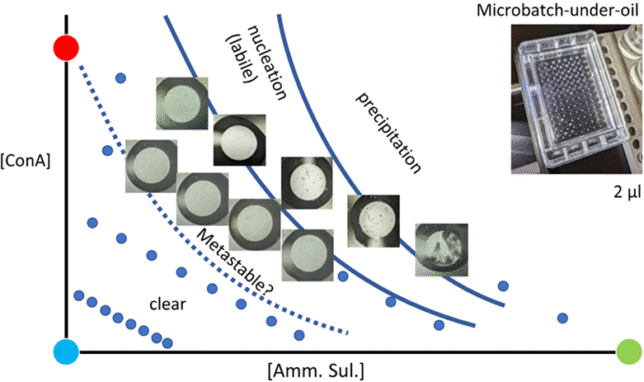
Figure 1. The rapid determination of a protein’s phase diagram using a microbatch-under-oil format. Blue circles indicate the conditions that were tested. Images of the wells are shown in conditions of interest. All points on the accessible phase diagram can be reached by mixing the three ingredients shown: protein stock (red circle), precipitant or cocktail stock (green circle) and a diluent, normally water (cyan circle). To find the border of the metastable zone (dotted line) the experiment was repeated with the addition of a seed-stock (results not shown).
[1] Stubbs, J., Hornsey, T., Hanrahan, L.B. Esteban, R. Bolton, M.
Maly, S. Basu, J. Orlans, D. de Sanctis, J. Shim, Shaw Stewart, P. D.,
A.M. Orville, I. Tews and West, J. (2024). IUCrJ 11.
[2] D’Arcy, A., Villard, F., Marsh, M. (2007). Acta Cryst. D63(4):550-4.